Plc trace
Plc trace is a tool to study and debug the plc code.
Trace is opened from the method 'Open Plc', or from a crossreference in the Plc code.
You can also open trace by selecting a PlcPgm in the navigator and activate
'Functions/OpenProgram' (Ctrl+L) in the menu.
To the left there are a navigation window where the displayed area is marked with a
square. By moving the square with drag MB1 you move the displayed area. You can also
zoom by dragging with the middle button.
Digital objects with height status are marked with red in the code.
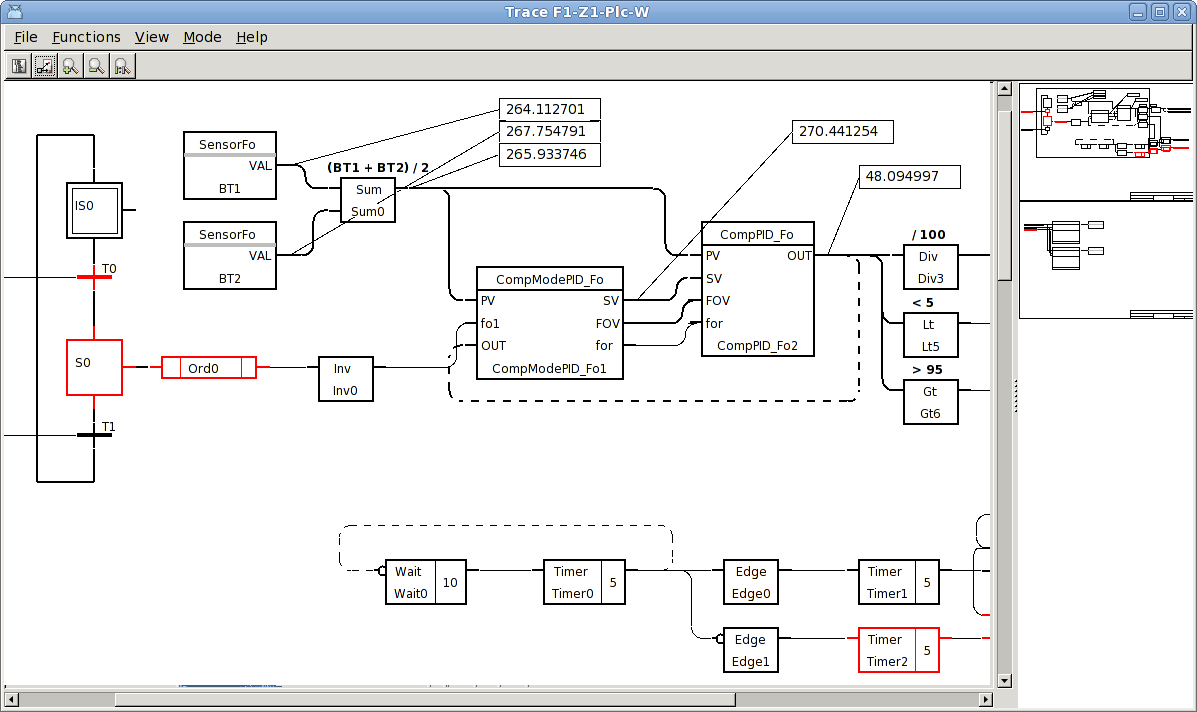
Fig Plc Trace
You can look at the value of analog or digital outputs by creating so called analyze nodes.
They are created by dragging with the middle button from the output pin.
A set of analyze nodes can be stored and restored by 'File/Save Trace' and
'File/Restore Trace' in the menu.
When rightclicking on an object the methods of the objects are displayed. A very useful
method in this context is crossreferences, The crossreferences are also displayed when
doubleclicking on the object.
Crossreferences
The crossreferences are a list of the places an object or attribute occur in the code or
in process graphs. If the reference implies reading the value, it is marked with a book,
if it implies writing the value, it is marked with a pen. Reading can be that the value
is displayed in a graph or fetched in the plc code. A write reference can be a pushbutton
in a graph or a Set or Sto object in the plc code.

Fig Crossreferences
By rightclicking on the crossreference, the plc or process graph the reference is pointing
at is opened. On plc references you can open PlcTrace with doubleclick. When Plc Trace is
opened the reference is marked and centered.
Debugging with Plc Trace and Crossreferences
Plc Trace and Crossreferences are a very efficient tool for troubleshooting.
A troubleshooting often starts out from an alarm or error indication in a process graph.
By activating the methods 'Crossreferences' or 'Open Plc' you find the place or places in
the code where the object is written. By analysing the code you conclude which signal
is missing, open the crossreferences for this and open PlcTrace where it is written. In
this way you can search in the code and finally find the cause of the problem.
Simulation
At simulation, i.e. when testing a system without the I/O system, you can set PlcTrace
in simulate mode with 'Mode/Simulate' in the menu. In simulate mode you can toggle
digital signals by clicking with Ctrl/Shift MB1 on them in the Plc Trace window.